Do Grão à Xícara: Entendendo a Cadeia de Valor do Café e Quem Lucra Com Ela
A jornada do café – do grão à xícara – é muito mais complexa do que parece. Valor econômico é criado e distribuído em cada etapa mas não de forma equitativa. Este artigo mergulha profundamente na cadeia de valor da indústria do café, analisando quem ganha o quê, por que persistem as desigualdades e como novos modelos e inovações estão transformando esse cenário.
1. As Etapas da Cadeia de Valor do Café
A cadeia típica de valor do café envolve várias etapas distintas:
Produtores / Cooperativas:
Pequenos agricultores plantam, colhem e, muitas vezes, realizam o processamento inicial (descascamento, secagem). Alguns vendem os frutos diretamente; outros entregam os grãos secos. A sustentabilidade surge como um desafio crítico, equilibrando viabilidade econômica, preservação ambiental e bem-estar social.
(coffeeplatform.ch)
Comerciantes, Exportadores e Importadores:
Cuidam da logística, conformidade com certificações, agregação e envio dos grãos verdes aos mercados e torrefações internacionais. Suas margens variam conforme a escala e eficiência.
(coffeeplatform.ch, Specialty Coffee Association)
Torrefadores:
Transformam o café verde em produto torrado e embalado, muitas vezes com forte presença de marca e marketing. Podem cobrar preços premium — especialmente no segmento de cafés especiais.
(Specialty Coffee Association, Wikipedia)
Varejistas / Cafeterias:
Vendendo o produto final ao consumidor — incluindo supermercados, redes e cafeterias boutique — geralmente desfrutam das maiores margens.
(Specialty Coffee Association, Wikipedia)
Consumidores:
São quem impulsionam a demanda, cada vez mais influenciados por preço, qualidade e origem ética. Suas preferências moldam a distribuição de valor.
(Specialty Coffee Association)
2. Quanto Valor é Capturado por Cada Ato?
Vários estudos fornecem uma clara divisão da distribuição de valor:
A. Exemplo do Varejo Alemão (€/kg)
Com base em análise da Specialty Coffee Association de uma marca nacional de café moído vendida na Alemanha (€8,06/kg preço de varejo):
| Ator | Margem Líquida (€ por kg) |
|---|---|
| Agricultores | €0,41 |
| Exportadores | €0,29 |
| Comerciantes | €0,26 |
| Torrefadores | €0,89 |
| Varejistas | €1,39 |
| Imposto sobre o café | €2,19 |
➡️ Isso mostra como a agricultura gera um lucro líquido mínimo, enquanto torrefadores e varejistas capturam parcelas muito maiores.
(Specialty Coffee Association)
B. Cadeia Típica de Café Especial (USD)
Em média global, agricultores recebem cerca de 10% do preço de varejo.
Para um latte de US$4, os produtores ganham em torno de US$0,40.
(noto studio, anteriormente Roast & Revel)
C. Padrões Globais de Distribuição de Valor
Um estudo acadêmico sobre o café colombiano mostra um desequilíbrio marcante:
- Produtores (89% dos participantes da cadeia) capturam apenas 5% do valor total.
- Exportadores: 9%, Importadores: 32%, Torrefadores: 45%.
(MDPI)
Tendências históricas indicam que a fatia dos produtores caiu de cerca de 20% nas décadas de 1970–80 para 13% nos anos 1990, enquanto países consumidores aumentaram sua fatia para 78%.
(MDPI)
3. Por Que a Distribuição É Tão Desigual?
Algumas ineficiências estruturais e de mercado explicam essa desigualdade:
- Assimetria de poder: Agricultores têm pouca transparência e influência nas negociações comerciais, resultando em práticas injustas. (MDPI)
- Comoditização e liberalização: A desregulamentação aumentou a volatilidade dos preços e enfraqueceu proteções aos produtores. (MDPI)
- Volatilidade dos mercados futuros: Bolsas como NYBOT (Arabica) e ICE London (Robusta) determinam preços globais. Agricultores sofrem quando especuladores causam oscilações extremas. (Wikipedia, MDPI)
- Custos de certificação: Selos de comércio justo e orgânicos prometem melhores preços, mas suas taxas e exigências reduzem os ganhos líquidos. (MDPI, Mordor Intelligence)
4. O Contexto Econômico Mais Amplo
- Valor do mercado global de café (2024–25): US$ 240–250 bilhões, com previsão de crescimento para US$ 320–380 bilhões até 2030–34.
(فودکس ایران, noto studio) - O café especial representa cerca de US$ 26 bilhões (2024) e deve alcançar US$ 62,5 bilhões até 2032.
(noto studio) - 95% das fazendas têm menos de 5 hectares, e 60% da produção global vem de pequenos produtores — muitos ainda em situação de pobreza.
(EatingWell) - Impactos climáticos: secas (como as causadas pelo El Niño no Brasil e Vietnã) aumentaram o custo do café verde em ~55%. Consumidores nos EUA pagam cerca de US$ 7,93 por libra torrada, mas os agricultores continuam recebendo apenas ~5% da receita da indústria (US$ 200 bilhões).
(EatingWell)
5. Inovações e Soluções: Quem Está Equilibrando a Balança?
A. Cooperativas – Uma Força de Empoderamento
Exemplo: Oromia Coffee Farmers Cooperative Union (Etiópia)
- Exporta diretamente, reduzindo intermediários.
- Devolve ~70% dos lucros aos membros (mais de US$ 3 milhões em dividendos pagos).
- Investe em escolas, clínicas, estradas e sistemas de água.
(Wikipedia)
B. Modelos de Comércio Direto
Alguns torrefadores eliminam intermediários, pagando prêmios mais altos:
Thrive Farmers: busca dobrar a renda dos agricultores conectando-os diretamente a compradores nos EUA.
(WIRED)
Comércio direto promove transparência e melhores relações, valorizado especialmente pela geração Z.
(Wikipedia, Medium)
C. Tecnologia e Rastreabilidade
Ferramentas como blockchain e plataformas digitais garantem:
- Transparência em cada etapa da cadeia.
- Maior confiança do consumidor.
- Potencial de distribuição mais justa do valor.
(MDPI)
D. Sustentabilidade e Adaptação Climática
Iniciativas que reduzem riscos climáticos e melhoram a renda incluem:
- IDH: práticas regenerativas e diversificação de renda (árvores frutíferas, meliponicultura), aumentando o lucro em ~10%.
(EatingWell) - Programas em Uganda e Quênia promovem compostagem e captação de água.
(EatingWell) - Illy: treina agricultores em agricultura regenerativa, elevando a produtividade e reduzindo custos.
(EatingWell)
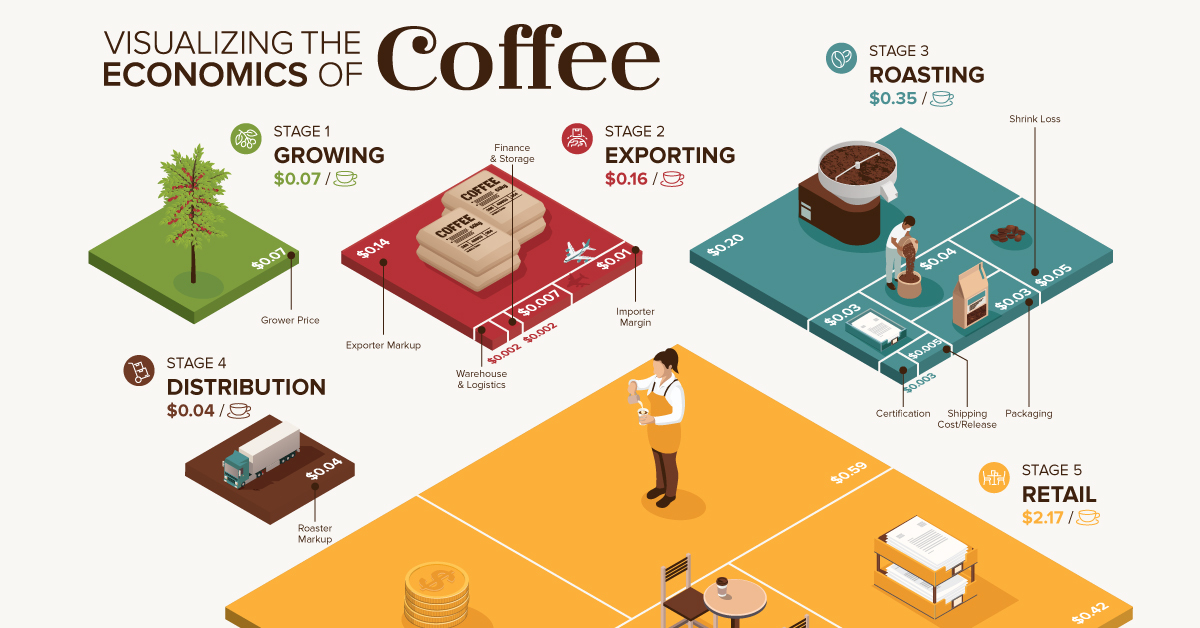
6. Visualizando a Cadeia (Descrição dos Infográficos)
- Gráfico de pizza (xícara de US$ 2,80): mostra US$ 0,07 para o agricultor, US$ 0,16 exportação, US$ 0,35 torrefação, US$ 0,04 distribuição, US$ 2,17 varejo.
- Fluxograma “Do grão à xícara”: ilustra o caminho completo da fazenda até o café.
- Gráfico em camadas econômicas: destaca margens em cada estágio da cadeia.
- Infográfico “Economia do Café”: resume visualmente desigualdades e centros de lucro.
7. Conclusão: Quem Realmente Lucra?
- Agricultores recebem 5–10% do preço final.
- Exportadores e comerciantes obtêm margens moderadas.
- Torrefadores ganham mais com processamento e branding.
- Varejistas e cafeterias capturam as maiores fatias — até 20% ou mais.
- Mudanças positivas como cooperativas, comércio direto, certificações e tecnologia mostram potencial, mas ainda não são universais.
💡 Em resumo:
Do grão à xícara, o café é um mosaico de economia, poder e vidas humanas. Embora torrefadores e varejistas ainda obtenham os maiores lucros, modelos mais éticos e sustentáveis estão abrindo caminho para um futuro mais equilibrado — onde o agricultor, a verdadeira origem do café, seja justamente recompensado.
Referências:
Specialty Coffee Association | MDPI | Wikipedia | WIRED | EatingWell | noto studio | Mordor Intelligence